Matplotlib (Static)
Using ipywidgets and matplotlib directly in your browser
import numpy as np
from matplotlib import pyplot as plt
fig = plt.figure()
n = 100_000
x = np.random.standard_normal(n)
y = 2.0 + 3.0 * x + 4.0 * np.random.standard_normal(n)
xlim = x.min(), x.max()
ylim = y.min(), y.max()
ax0 = plt.axes()
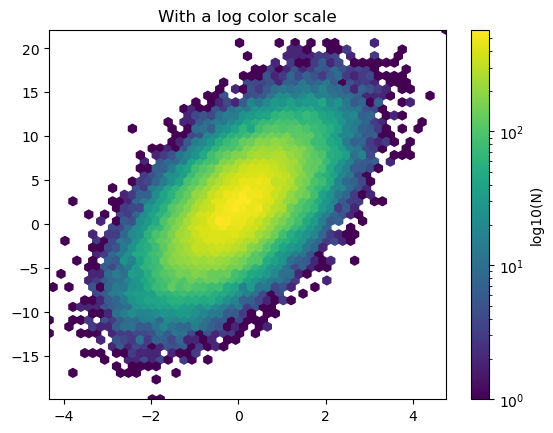
hb = plt.hexbin(x, y, gridsize=50, bins='log')
ax0.set(xlim=xlim, ylim=ylim)
ax0.set_title("With a log color scale")
fig.colorbar(hb, ax=ax0, label='log10(N)')
plt.show()